元のファイル(SVG ファイル、702 × 648 ピクセル、ファイルサイズ: 2キロバイト)

概要

解説
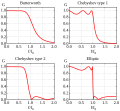
English: Frequency response curves of four linear analog filters: Butterworth filter, Chebyshev filter of type 1 and 2 and Elliptic filter, each one as 5th order filter.
Português: Curvas de resposta em frequência de quatro filtros lineares analógicos: Butterworth, Chebyshev tipos 1 e 2 e elíptico, todos de quinta ordem.
Русский: Сравнение амплитудно-частотных характеристик фильтров 5-го порядка: Баттерворта, Чебышёва 1-го и 2-го типов и эллиптического.
日付
原典 投稿者自身による著作物
作者 Geek3
その他のバージョン
SVG 開発
InfoField
 
このSVGのソースコードは正しい
 
この ベクター画像Matplotlibで作成されました。
 
 このSVGファイルは埋込み文を用いており,テキストエディタを用いて容易に翻訳することができますいます。
ソースコード
InfoField
Python Matplotlib source code
#!/usr/bin/python
# -*- coding: utf8 -*-

import numpy as np
import scipy.signal as sig
import matplotlib as mpl
import matplotlib.pyplot as plt
from math import *

N = 5 # order of the filters
band = 1.0 # cut-off normalized frequency
Rpass = 1.0 # ripple in the pass-band (dB)
Rstop = 20 # ripple in the stop-band (dB)
frange = np.linspace(0, 2, 2001)
color = 'r'
fname = 'filters_order5.svg'

mpl.rcParams['axes.grid'] = True
plt.figure(figsize=(6, 5.4))

(num, den) = sig.butter(N, band, analog=True)
filterfy = sig.freqs(num, den, frange)
plt.subplot(221)
plt.title('Butterworth')
plt.plot(filterfy[0], np.abs(filterfy[1]), lw=3, color=color)

(num, den) = sig.cheby1(N, 1, band, analog=True)
filterfy = sig.freqs(num, den, frange)
plt.subplot(222)
plt.title('Chebyshev type 1')
plt.plot(filterfy[0], np.abs(filterfy[1]), lw=3, color=color)

(num, den) = sig.cheby2(N, Rstop, band, analog=True)
filterfy = sig.freqs(num, den, frange)
plt.subplot(223)
plt.title('Chebyshev type 2')
plt.plot(filterfy[0], np.abs(filterfy[1]), lw=3, color=color)

(num, den) = sig.ellip(N, Rpass, Rstop, band, analog=True)
filterfy = sig.freqs(num, den, frange)
plt.subplot(224)
plt.title('Elliptic')
plt.plot(filterfy[0], np.abs(filterfy[1]), lw=3, color=color)

for ax in plt.gcf().get_axes():
    ax.set_xlim(*frange[[0,-1]])
    ax.set_ylim(0, 1.1)
    ax.set_xlabel('f/f$_0$')
    ax.xaxis.set_label_coords(0.65, -0.1)
    ax.set_ylabel('G', rotation=0)
    ax.yaxis.set_label_coords(-0.05, 1.0)

plt.tight_layout(pad=1, w_pad=2, h_pad=2)
plt.savefig(fname)

def postprocess(fname):
    from lxml import etree
    with open(fname, 'r') as svgfile:
        tree = etree.parse(svgfile, etree.XMLParser(remove_blank_text=True))
    svg = tree.getroot()
    nsmap = '{' + svg.nsmap[None] + '}'

    # move all definitions to the front
    svg[:] = sorted(svg, key=lambda el: {False:0, True:1}[el.tag!=nsmap+'defs'])
    with open(fname, 'w') as svgfile:
        tree.write(svgfile,
            xml_declaration=True, pretty_print=True, encoding='utf-8')

postprocess(fname)

ライセンス

この作品の著作権者である私は、この作品を以下のライセンスで提供します。
w:ja:クリエイティブ・コモンズ
表示
このファイルはクリエイティブ・コモンズ 表示 4.0 国際ライセンスのもとに利用を許諾されています。
あなたは以下の条件に従う場合に限り、自由に
  • 共有 – 本作品を複製、頒布、展示、実演できます。
  • 再構成 – 二次的著作物を作成できます。
あなたの従うべき条件は以下の通りです。
  • 表示 – あなたは適切なクレジットを表示し、ライセンスへのリンクを提供し、変更があったらその旨を示さなければなりません。これらは合理的であればどのような方法で行っても構いませんが、許諾者があなたやあなたの利用行為を支持していると示唆するような方法は除きます。

キャプション

このファイルの内容を1行で記述してください

10 12 2016

ファイルの履歴

過去の版のファイルを表示するには、その版の日時をクリックしてください。

日付と時刻サムネイル寸法利用者コメント
現在の版2023年10月8日 (日) 21:572023年10月8日 (日) 21:57時点における版のサムネイル702 × 648 (2キロバイト)Hugo SpinelliChanged path to text. Now using Liberation Serif. Centered the label on the horizontal axis.
2016年12月10日 (土) 21:472016年12月10日 (土) 21:47時点における版のサムネイル540 × 485 (76キロバイト)Geek3== {{int:filedesc}} == {{Information |Description ={{en|1=Frequency response curves of four linear analog filters: {{W|Butterworth filter}}, {{W|Chebyshev filter}} of type 1 and 2 and {{W|Elliptic filter}}, each one as 5th order filter.}} |Source...

グローバルなファイル使用状況

以下に挙げる他のウィキがこの画像を使っています:

メタデータ