ファイル:2006Uzbekistani exports.PNG

このプレビューのサイズ: 800 × 351 ピクセル。 その他の解像度: 320 × 140 ピクセル | 640 × 281 ピクセル | 1,425 × 625 ピクセル。
元のファイル (1,425 × 625 ピクセル、ファイルサイズ: 59キロバイト、MIME タイプ: image/png)
ウィキメディア・コモンズのファイルページにある説明を、以下に表示します。
|
概要
| 解説 |
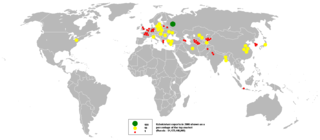
English: This bubble map shows the global distribution of Uzbekistani exports in 2006 as a percentage of the top market (Russia - $1,172,440,000).
This map is consistent with incomplete set of data too as long as the top producer is known. It resolves the accessibility issues faced by colour-coded maps that may not be properly rendered in old computer screens. Data was extracted on 19th September 2007 from http://www.imfstatistics.org/DOT Based on :Image:BlankMap-World.png |
| 日付 | 2007年9月19日 (当初のアップロード日) |
| 原典 | en.wikipedia からコモンズに Stefan4 によって CommonsHelper を用いて移動されました。 |
| 作者 | 英語版ウィキペディアのAnwar saadatさん |
ライセンス
この作品の著作権者である英語版ウィキペディアのAnwar saadatさんは、この作品を以下のライセンスで提供しています。
このファイルはクリエイティブ・コモンズ 表示-継承 3.0 非移植ライセンスのもとに利用を許諾されています。
帰属: 英語版ウィキペディアのAnwar saadatさん
- あなたは以下の条件に従う場合に限り、自由に
- 共有 – 本作品を複製、頒布、展示、実演できます。
- 再構成 – 二次的著作物を作成できます。
- あなたの従うべき条件は以下の通りです。
- 表示 – あなたは適切なクレジットを表示し、ライセンスへのリンクを提供し、変更があったらその旨を示さなければなりません。これらは合理的であればどのような方法で行っても構いませんが、許諾者があなたやあなたの利用行為を支持していると示唆するような方法は除きます。
- 継承 – もしあなたがこの作品をリミックスしたり、改変したり、加工した場合には、あなたはあなたの貢献部分を元の作品とこれと同一または互換性があるライセンスの下に頒布しなければなりません。
元のアップロードログ
元のファイルページはこちら。以下の利用者は全てen.wikipediaに属します。
- 2007-09-19 19:13 Anwar saadat 1425×625× (60408 bytes) This bubble map shows the global distribution of Uzbekistani exports in 2006 as a percentage of the top market (Russia - $1,172,440,000). This map is consistent with incomplete set of data too as long as the top producer is known. It resolves the accessi
ファイルの履歴
過去の版のファイルを表示するには、その版の日時をクリックしてください。
| 日付と時刻 | サムネイル | 寸法 | 利用者 | コメント | |
|---|---|---|---|---|---|
| 現在の版 | 2011年11月10日 (木) 20:17 | | 1,425 × 625 (59キロバイト) | File Upload Bot (Magnus Manske) | {{BotMoveToCommons|en.wikipedia|year={{subst:CURRENTYEAR}}|month={{subst:CURRENTMONTHNAME}}|day={{subst:CURRENTDAY}}}} {{Information |Description={{en|This bubble map shows the global distribution of Uzbekistan |
ファイルの使用状況
以下のページがこのファイルを使用しています:
グローバルなファイル使用状況
以下に挙げる他のウィキがこの画像を使っています:
- cs.wikipedia.org での使用状況
- en.wikipedia.org での使用状況
- hy.wikipedia.org での使用状況
- io.wikipedia.org での使用状況
- mk.wikipedia.org での使用状況
- zh.wikipedia.org での使用状況